.jpg) Thought LeadersShenna D'Arcy & Prohwijit SarkarD'Arcy Group Univeristy of Texas
Thought LeadersShenna D'Arcy & Prohwijit SarkarD'Arcy Group Univeristy of Texas In this interview, Sheena D'Arcy and Prithwijit Sarkar from the D'Arcy Group in the Department of Chemistry and Biochemistry at the University of Texas at Dallas talks to News-Medical Life Sciences about using SEC-MALS to characterize the native oligomeric state of Nap proteins and their complexes.
What is SEC-MALS?
SEC-MALS is size-exclusion chromatography coupled to multi-angle light scattering. The SEC component is comprised of an HPLC or FPLC pump and SEC column plus a UV absorption detector. An aliquot of solution that typically contains a mixture of different protein species is injected and flows through the packed column.
As the size-exclusion column separates the proteins based on their size (hydrodynamic radius), the solution enters a UV detector which measures the UV absorption of each eluting fraction, producing a chromatogram.
Each eluting peak in the chromatogram can be analyzed to determine the peak height, shape, and elution volume, so we get some information about the proteins in the original mixture such as their abundance, homogeneity and an estimate of their molecular weight. But, to get a more quantitative molecular weight and homogeneity information, the samples pass into a light scattering detector.
Our lab uses Wyatt Technology’s miniDAWN MALS instrument coupled to an Optilab differential refractive index (dRI) detector, also from Wyatt. The miniDAWN is a three-angle light scattering detector, which can determine molecular weight from a few hundred Daltons up to 10 million Daltons and it can also measure molecular size (rms radius) from 10 to 50 nm.
The dRI detector measures the change in refractive index relative to pure buffer, which is analyzed to determine the concentration of our proteins. It is similar to the UV detector but with the benefit that there is no need to know which protein is eluting or the absorption coefficient of each type since the dRI response is nearly the same for almost all proteins. MALS analysis of molecular weight requires both the light scattering and concentration data.
Now, all these systems are connected to a computer, where we collect, visualize, process and analyze the data. We use software called ASTRA, also from Wyatt. It is user-friendly and simple to use. Data processing in ASTRA takes about five to 10 minutes once you get the hang of it, and that is the last component in our SEC-MALS set up.
What is the principle of SEC-MALS?
SEC or size-exclusion chromatography involves flowing the solution through a column packed with material that includes lots of pores. Smaller molecules spend more time diffusing in and out of the pores, and so they elute from the column later than larger molecules that cannot actually fit into some of the pores. This technology separates our proteins or mixtures based on diffusion properties which are influenced by size and shape, primarily the hydrodynamic radius. In many, but by no means all, cases, molecular weight is relative to the hydrodynamic radius, so it is common to estimate molecular weight from the time it takes each fraction to elute from the column.
The fractions exiting the column and UV detector enter into the light scattering system. Here a laser illuminates the solution as it passes through, and light is scattered by the proteins or actually by anything that differs in optical properties from the buffer (also known as mobile phase). The scattered light is measured by the miniDAWN’s three photodiodes, and the signals are analyzed to determine the molecular weight (MW) every second or so during the elution.
The formula used in the calculation takes into account that the measured intensity of the scattered light is proportional to the protein’s molecular weight, concentration and refractive index increment dn/dc.
The refractive increment is a known value that is assumed to be constant for all proteins in typical aqueous buffers; concentration can be measured by the UV detector but more commonly the dRI detector signal is used since it does not depend on the specific protein. So if scattered intensity, concentration and dn/dc are known, we get the molecular weight at each time point across each peak in the chromatogram.
Why did you choose to use SEC-MALS?
From crystallography, we observed that C. elegans Nap1 (or worm Nap1) and S. cerevisiae Nap1 (or yeast Nap1) are highly similar in terms of structure, but we wanted to look at the differences, and different solution properties. SEC-MALS lets us do just that.
Nap proteins are dimers, but also oligomerize in a salt-dependent manner, so being buffer-versatile was also another important factor we had to consider. SEC-MALS lets us run our samples in different buffers, with different salts and pH values, which was very important for this protein system. It also requires a low protein amount, unlike other techniques such as analytical ultracentrifugation which requires ~ 1 mL of sample. SEC-MALS just requires 0.1 mL of the sample at a really low protein concentration.
Another important factor was that proteins do not need to be modified for SEC-MALS. Many techniques require some sort of mutation or modification like a fluorescence tag, but SEC-MALS did not need that, and it was good because our worm Nap1 protein was previously uncharacterized, so we wanted to study it in its wild-type state.
It is great to visualize Nap proteins’ heterogeneity using SEC-MALS since they form oligomers. It is not only great to visualize it, but also to quantitate it by getting the molecular weight across the peak so the degree of homogeneity or heterogeneity could be assessed.
How easy is data acquisition from SEC-MALS?
The data acquisition from SEC-MALS was fast, easy and straightforward, and data processing only took about 5-10 minutes after each run was done. But the most important thing is that SEC-MALS lets us visualize the absolute stoichiometry (as opposed to the relative stoichiometry) of our protein complexes.
Absolute stoichiometry is the actual number of proteins in a complex, say four Naps bound to two histones, or 4:2 complex, whereas relative stoichiometry is just the ratio, so it would say just 2:1. It can also determine the oligomeric state of uncomplexed proteins. These abilities set SEC-MALS apart from most other biophysical techniques.
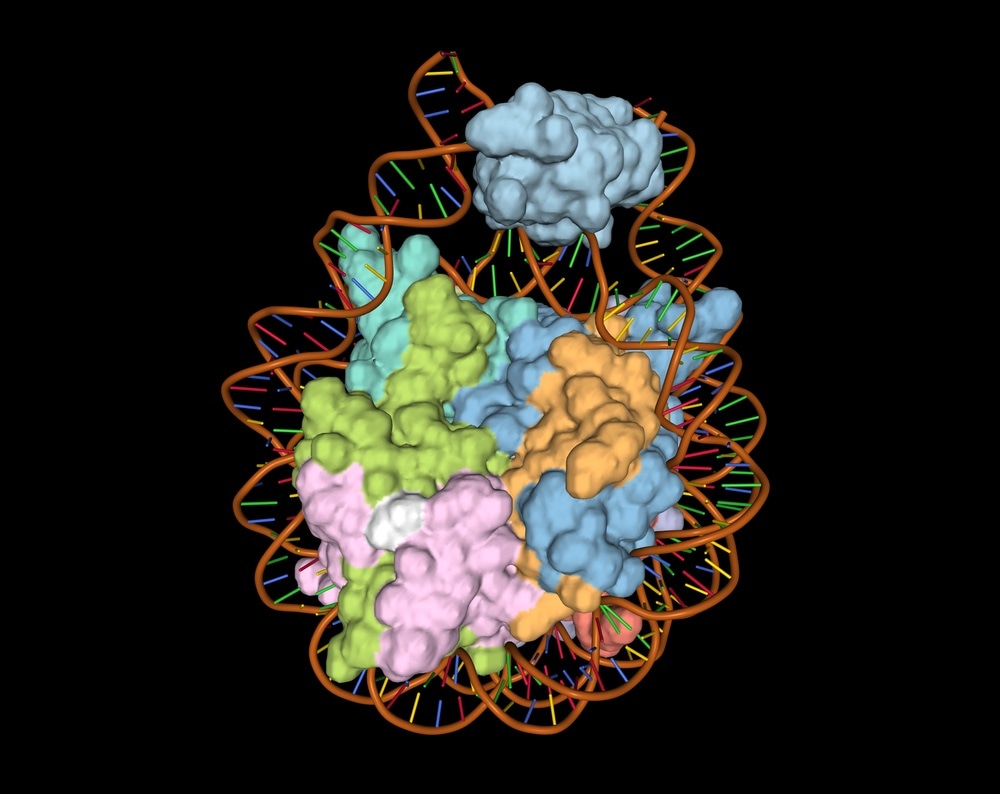
A DNA-histone complex. Image Credit: Volodymyr Dvornyk / Shutterstock.com
What are histones?
Histones are basic proteins that make up the core of the nucleosome. There are two copies of H3-H4, and two copies of H2A-H2B, which together form an octamer. DNA wraps around this octamer, forming the nucleosome. The nucleosome is the structural and functional unit of chromatin, and nucleosome assembly proteins, or Naps, bind to these histones and regulate nucleosome assembly and disassembly. Overall, they regulate chromatin architecture and are important for different nuclear activities.
Histones can exist as separate entities and are stable by themselves. Histones H3 and H4 form a heterotetramer, and histones H2A-H2B form a heterodimer. We learned previously that Nap proteins are constitutive homodimers and like to oligomerize in a salt-dependent manner.
Next, we study the oligomerization of Nap1-histone complexes using SEC-MALS and determine the stoichiometry of these complexes.
 Illustration of a chromosome and histones with DNA wrapped around them. Image Credit: lanatoma / Shutterstock.com
Could you talk through the experiment design to give readers an understanding of the oligomerization and stoichiometry of Nap1-histone complexes?
In this SEC-MALS system, we first inject 20 µM of Nap1 in a column pre-equilibrated with 300 mM NaCl. Our next sample is Nap1, but with titrations of H2A-H2B or H3-H4. Our samples will include histone titrations in molar equivalents of 0.5, 1.5 and 2.0 to Nap1. The chromatograms show that not only is there an increase in the height of the peak, but also the peak shifts to the left, indicating the formation of a larger protein complex.
If this was not obvious enough, we also have MW traces that increase upon histone titration to Nap1. We compare the observed MW traces to the theoretical MW of Nap1-histone complexes, either 2:1 Nap1-histone, or 2:2 Nap1-histone complexes, and make comparisons to determine stoichiometry of our protein complexes.
Does worm Nap1 bind H2A-H2B differently than yeast Nap1?
We saw that when we titrate H2A-H2B to worm Nap1, the peak shifted to the left, indicating that a larger complex was being formed. And initially, there was an increase in the height of the peak, but eventually, it reached saturation at the higher titration points. Along with that, we saw that the MW trace reached a complex with 2:1 Nap1:H2A-H2B stoichiometry. Upon further titration, beyond an equimolar amount (1.5 and 2.0 molar equivalents), the MW trace did not increase beyond 2:1 and there was an emergence of a free H2A-H2B peak.
We did not get a molecular weight trace of the H2A-H2B peak, because these proteins are small and have low LS signal, hence the error associated with it is slightly higher, and we do not report them. However, we are confident it is H2A-H2B because it is just a two-protein system; it is H2A-H2B that is coming out.
We compared this result to yeast Nap1 and observed a difference. When we titrated H2A-H2B to yeast Nap1, we saw that the peak height consistently increased, and not only that, but then the MW trace first hit a 2:1 stoichiometry of Nap1:H2A-H2B, and eventually started approaching a 2:2 complex.
The MW trace did not hit saturation, which indicates that the yeast Nap1 was able to bind a second copy of H2A-H2B, but these complexes were very dynamic and there was a constant exchange between a 2:1 and a 2:2 yeast Nap1:H2A-H2B complex.
To conclude, worm Nap1 has a complex stoichiometry of 2:1 with H2A-H2B, however, yeast Nap1-H2A-H2B can have a 2:2 stoichiometry or a 2:1 stoichiometry.
What did your experiments reveal about the interaction between Nap1 and H3-H4?
When we titrate H3-H4 to worm Nap1, we see that there is a large left-shift in the peak, as well as an increase in peak height when we move up the titration. This itself just indicates that a large protein complex is being formed. However, when we look at molecular weight traces, we see that the molecular weight traces approach a 4:2 complex at the beginning of the titration, and as we move further up, we observe the complex stoichiometry reaching a 4:6 Nap1:H3-H4 complex.
Similarly, with yeast Nap1, we observed the same trend where we see a large left-shift in the peak, an increase in peak height, as well as the stoichiometry reaching a 4:6 Nap1:H3-H4 complex. It is interesting to note that both the Nap proteins behave similarly and oligomerize with H3-H4, and we hypothesize that the protein complex under the peak form a heterogeneous mix in dynamic equilibrium, that is constantly exchanging between different states.
It is also interesting to mention that the H2A-H2B binding mode is different in these two Nap proteins, because worm Nap1 binds to H2A-H2B at a 2:1 stoichiometry, whereas yeast Nap1 binds to H2A-H2B at a 2:2 or a 2:1 stoichiometry. With H3-H4, both Nap proteins tend to oligomerize. We predict that the oligomerization is mediated by an H3-H3 tetramerization interface, so we to try to determine the absolute stoichiometry of these Nap proteins with H3-H4.
We introduced point mutations at residues 110,126 and 130 position on H3 and changed them to alanines, and observed that H3-H4 cannot tetramerize anymore and remain exclusively dimeric. We call this H3-H4 mutant ‘DM-H3-H4’, or Dimeric Mutant H3-H4. We then perform SEC-MALS experiments to see the oligomerization and the stoichiometry of the Nap1-DM-H3-H4 complexes.
Our prediction turned out to be true – the complex of Nap1 and H3-H4 oligomerizes because of the H3-H4 tetramerization. We saw that when we titrated DM-H3-H4 to our worm or yeast Nap1, initially we got a 2:1 complex, but upon further titration, we saw that the complex approached a 2:2 stoichiometry for both of these Nap proteins.
We did not observe the 4:2 and 4:6 stoichiometries/oligomerization, which means that the mutation made on H3-H4 abolished not only the H3-H4 tetramerization but the higher-order oligomerization of Nap1-H3-H4 complexes as well. Similarly, we saw that the worm and yeast Nap1 behaved similarly. Their complex stoichiometries are both 2:2 with DM-H3-H4.
To summarize our work, in this study we characterized Nap1 from C. elegans biochemically and structurally. Its structure is almost identical to the yeast Nap1's core domain. Yeast Nap1 possesses an acidic N and C-terminal tail, whereas worm Nap1 naturally lacks this N-terminal tail, and only has a short C-terminal tail. Because of its high sequence conservation in the core domain, we thought that worm Nap1 would be a great model protein to study and investigate the role of the tails in Nap1 self-oligomerization, histone-binding, and stoichiometries of histone-bound complexes.
Using SEC-MALS, we revealed that worm Nap1 can bind only one copy of H2A-H2B, whereas yeast Nap1 can bind one or two copies of H2A-H2B. The study suggests that the second copy of H2A-H2B can be bound by the N or the C-terminal tail that is present in yeast Nap1. When the Nap proteins bind H3-H4, they form higher-order oligomeric complexes in the order of 4:2 or 4:6 stoichiometries. This is both similar in worm Nap1 as well as yeast Nap1.
We hypothesized that the tetramerization interface of H3-H4 causes the large oligomeric complexes to form. When we mutate them to form exclusively dimeric H3-H4, we lose the oligomerization of Nap-histone complexes and reveal an absolute stoichiometry of Nap1:H3-H4 2:2 complex, both in worm Nap1 as well as in yeast Nap1.
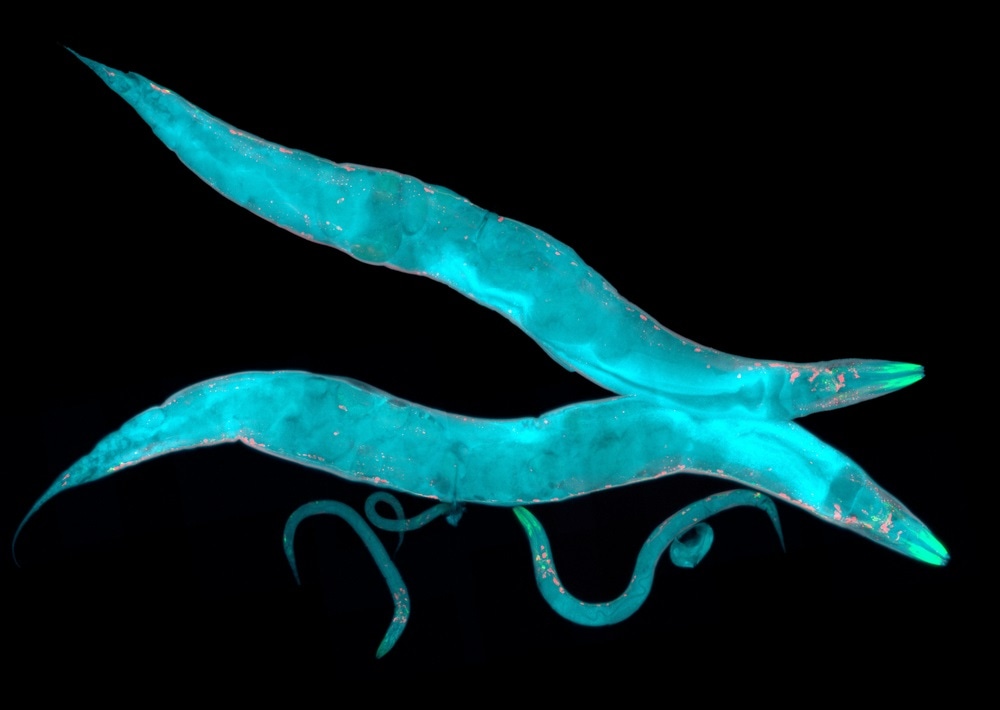 Nap1 from the C. elegans roundworm was characterized biochemically and structurally. Image Credit: Heiti Paves / Shutterstock.com
What was one of the most important things that SEC-MALS allowed you to do in your work?
I think we can appreciate the very straight forward approach of SEC-MALS – it has provided quite a lot of insight into how Nap proteins bind histones.
SEC-MALS has enabled us to characterize the native oligomeric state of Nap proteins and their complexes. We did not have a very straightforward system, as we had high-affinity oligomers, dynamic self-association, and a dependence on buffer conditions, but we were able to get a handle on all of these by using SEC-MALS.
Possibly the most important thing, however, was that SEC-MALS gave us the absolute stoichiometry of our complexes. We were able to get this by analyzing a series of stoichiometric ratios. Now, this is noteworthy, as most of the techniques only determine relative stoichiometric ratios. This was important for Nap proteins and histones, as several are already known to oligomerize both inside and outside of their complex.
We have had the SEC-MALS instrument in our lab for just a few years, but it is in almost constant use and the students know how to use it, thanks to the Wyatt Technology’s Light Scattering University, which Prithwijit attended in 2017 and found extremely useful.
Posted in: Molecular & Structural Biology | Thought Leaders | Automation & Sample Preparation
Tags: Amino Acid, Chromatin, Chromatography, Crystallography, DNA, Fluorescence, Histones, Mutation, pH, Protein, S. cerevisiae, students, Titration, Yeast
Source: Read Full Article